
Most Business Intelligence projects build the wrong thing beautifully.
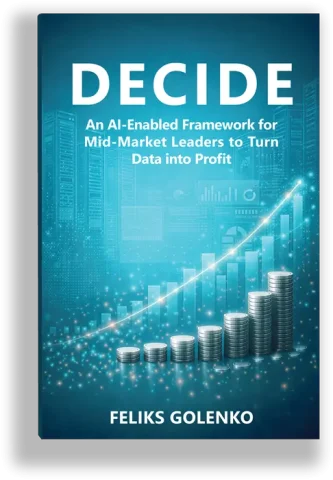
DECIDE fixes that. Six steps, in sequence, starting with the decisions that matter, not the data you happen to have.
D
STEP 01
Discover
E
STEP 02
Engage
C
STEP 03
Clarify
I
STEP 04
Illustrate
D
STEP 05
Develop
E
STEP 06
Embed
BI is a decision problem.
Technology is the last step, not the first.
Most BI projects start with the data. Choose a platform. Clean the data. Build dashboards. Then hope the insights follow. It sounds logical. It’s the reason most BI projects fail.
DECIDE starts at the other end. Before a single dashboard is built, we identify the decisions that matter most to your business, the people who make those decisions, and the information they actually need. Then we build only what those decisions require. Nothing more. Nothing less.
This isn’t theory. DECIDE was built from 1.500+ projects across 35 years. Every step exists because we saw what happens when it’s skipped.
Six steps. Each one exists for a reason.
Discover
Where does better intelligence create the most business value?
- Map the decisions that affect your P&L, operations, and competitive position.
- Define scope by decisions needed, not data available.
- Output: a prioritised list of decision areas where better intelligence changes outcomes.
We map the decisions that drive your P&L, your operations, your competitive position. Not every decision, the ones where better data changes the outcome. This is where scope gets defined: not by what data you have, but by what decisions you need to make. It’s where the ROI of the entire initiative is determined, before a single dashboard is designed.

Engage
Who actually makes those decisions?
- Sit with the CFO, Head of Sales, COO, not “the business” as an abstraction.
- Understand what they trust, what they ignore, and how they talk about the business.
- Output: a decision-maker map and a clear picture of current information gaps.
Not “the business.” Specific people. The CFO preparing for the board. The Head of Sales allocating territory budgets. The COO choosing which plants run which shifts. We sit with them. We learn how they think, what they trust, and what they ignore. We build for actual humans in real decision situations, not theoretical users in a requirements document.
Clarify
What questions do those decision-makers need answered?
- Define the exact questions each decision-maker needs answered.
- Anything that does not answer a specific question is noise.
- Output: a question library per decision context, signed off by the decision-makers.
Not 47 KPIs on a dashboard. Three to five questions per decision context. “Why did EBITDA margin compress by two points last quarter?” “Which customer segments are growing and which are quietly eroding?” If a report doesn’t answer a specific question, it’s noise.

Illustrate
Before we build anything, we prototype it.
- Paper sketches and clickable mockups shown to real decision-makers.
- Test: “Would you use this? Does this match how you talk about the business?”
- Output: approved designs before a single line of code is written.
Paper sketches. Clickable mockups. We put them in front of the decision-makers from Step 2 and ask: “Would you use this? Does this match how you talk about the business?” If the answer is no, we redesign. That costs hours, not months. Building first and never testing is how timelines double.
Develop
Now we build.
- Each sprint delivers a working product your team can use immediately.
- No 18-month marathons before the first result.
- Output: production-ready dashboards, data pipelines, and semantic models, sprint by sprint.
We build on proven technology (Microsoft Fabric, Power BI) using focused sprints. Each sprint delivers something your team can use immediately. We prove value before we scale. No one invests six figures based on a slide deck. They invest because the first delivery already changed how they run the business.


Embed
A dashboard that nobody opens is not a result.
- Weekly leadership reviews, monthly board packs, automated, running on trusted data.
- Training, documentation, and handover until your team owns it.
- Output: decision rhythms that run on data, not reconstructed spreadsheets.
Embed means the insights we built become part of how your business operates. Weekly leadership reviews. Monthly board packs that auto-generate. Decision rhythms that run on trusted data instead of reconstructed spreadsheets. We don’t launch and leave. We stay until the new way of working is the only way of working.
— THE SIX MISTAKES—
Six mistakes we see in almost every
company we walk into.
Each mistake maps to one DECIDE step. Each one is something we’ve seen dozens of times across 1.500+ projects. If any of these sound familiar, you’re not alone.
MISTAKE 01 · DISCOVER
Starting with the tool, not the decision.
The Symptom.
Budget approved for a BI platform before anyone asks which decisions it will change.
The Outcome.
Dashboards that look impressive in the demo. Nobody opens them in practice.
The board greenlights EUR 80K for a BI project. IT picks the platform. A consulting firm runs a requirements workshop. Six months later, the company owns a set of dashboards that look impressive in the demo and that nobody opens in practice. The problem was never the tool. The problem was that nobody asked: “Which decisions will this change?”
MISTAKE 02 · ENGAGE
Building for "the business," not real decision-makers.
The Symptom.
A 47-KPI dashboard built for “comprehensive reporting.” Nobody asked specific people what they actually need.
The Outcome.
Two people log in. Neither makes decisions that affect the P&L. The CFO never opens it.
The project team builds a generic dashboard with 47 KPIs because “the business” asked for comprehensive reporting. Go-live day arrives. Two people log in regularly. Neither makes decisions that affect the P&L. The CFO never opens it because it doesn’t match how she thinks about the business. Adoption was dead before launch because nobody asked the right people what they actually need.
MISTAKE 03 · CLARIFY
Reporting everything, answering nothing.
The Symptom.
A 40-slide board pack. 18 charts. Everything measured. Nothing answered.
The Outcome.
After 45 minutes, the CEO asks: “But why did EBITDA margin compress by two points?” Silence.
The monthly board pack is 40 slides. 18 charts. Revenue by region, margin by product, headcount by department. Beautifully formatted. And after 45 minutes of presentation, the CEO still asks: “But why did EBITDA margin compress by two points?” Silence. The report shows everything. It answers nothing. Because nobody defined which questions the data needs to answer before the first chart was built.
MISTAKE 04 · ILLUSTRATE
Building first,
never testing.
The Symptom.
Eight weeks of development before the first user sees the product.
The Outcome.
“This is not how I think about the business.” Rebuild from scratch. Timeline doubled
Eight weeks into a BI build, the project team presents the first working version to the Head of Controlling. She looks at it for three minutes and says: “This isn’t how we talk about the business. The categories are wrong. The time periods don’t match our reporting cycle.” Rework. Doubled timeline. Eroded trust. All avoidable if someone had shown her a sketch in week one instead of a finished product in week eight.
MISTAKE 05 · DEVELOP
Over-engineering the foundation before proving value.
The Symptom.
An 18-month, EUR 320K data platform. Perfect architecture. 70% complete. No business result yet.
The Outcome.
Board loses patience. Project cancelled. EUR 320K spent with zero operational output.
An 18-month, EUR 320K data platform project. The architecture is perfect. The data model is pristine. The project is 70% complete. And the business still hasn’t seen a single insight, because “the foundation needs to be right first.” Meanwhile, a competitor proved the value of their data in four weeks with a focused pilot. Foundations matter. But a foundation nobody builds on is a cost centre, not an investment.
MISTAKE 06 · EMBED
Launching dashboards, not decision rhythms.
The Symptom.
Go-live email sent. Training session recorded. SharePoint link shared.
The Outcome.
Three months later, the CFO still rebuilds the board pack in Excel every month.
Go-live email sent on a Tuesday. Training session recorded. SharePoint link shared. Three months later, the CFO still rebuilds the board pack manually in Excel every month, because the new system was launched into a vacuum. No one changed the meeting structure. No one redefined the reporting cadence. Launch is not adoption. Dashboards don’t change organisations. Decision rhythms do.
These six mistakes share one root cause: starting with the tool instead of the decision. DECIDE exists to prevent all six.
— THE RESULT —
Three things that make DECIDE different from every other BI approach.
Decision-first design,
not tool-first.
Most BI projects start by choosing a platform and then figuring out what to build. DECIDE starts by identifying which decisions create the most business value and works backwards from there. The technology is the last choice, not the first.
Prove value before
scaling.
We don’t ask for a six-figure commitment based on a slide deck. We prove the value of your data in weeks, with a focused pilot. If the value is there, we scale. If it’s not, you’ve invested a fraction and gained absolute certainty. No 18-month gambles.
Embed into operations, not launch and leave.
A BI project that ends at go-live is only half done. DECIDE includes embedding insights into your decision rhythms: the weekly reviews, the monthly board packs, the daily operational cadence. Dashboards are a delivery mechanism. Decisions are the result.
— THE GAMEPLAN SESSION —
Your dashboards and reports are showing you what happened. They are not showing you where the profit is. That is the problem. And it is solvable.
30 minutes with Feliks Golenko. We work out exactly where to start.